What is sampling
Figure 1
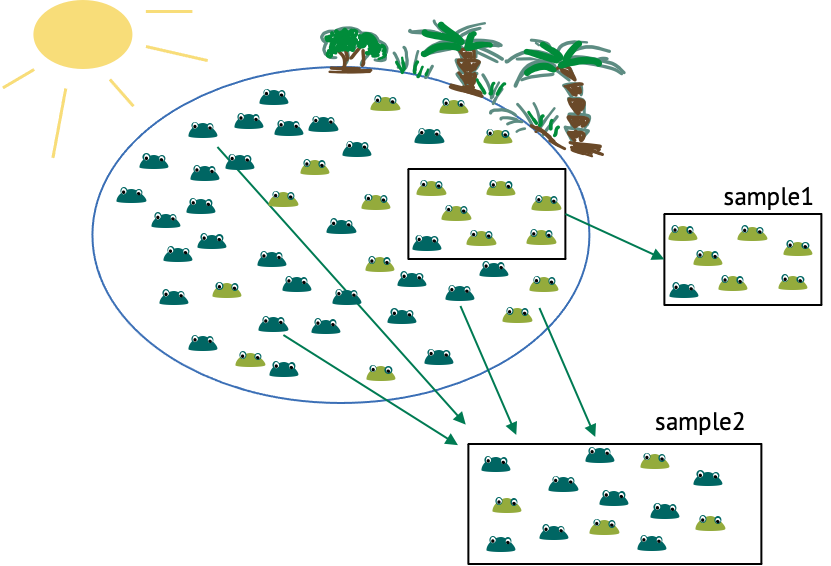
Sampling frogs in a lake
What is a probability distribution?
Figure 1
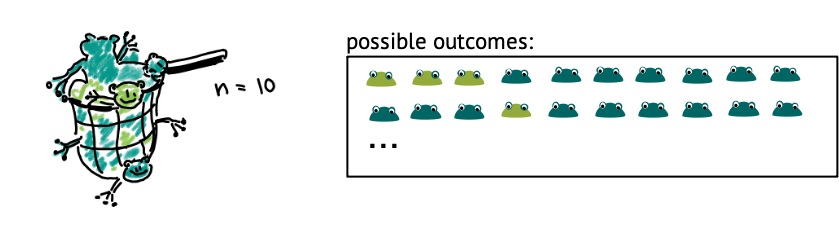
Binomial sampling
Figure 2
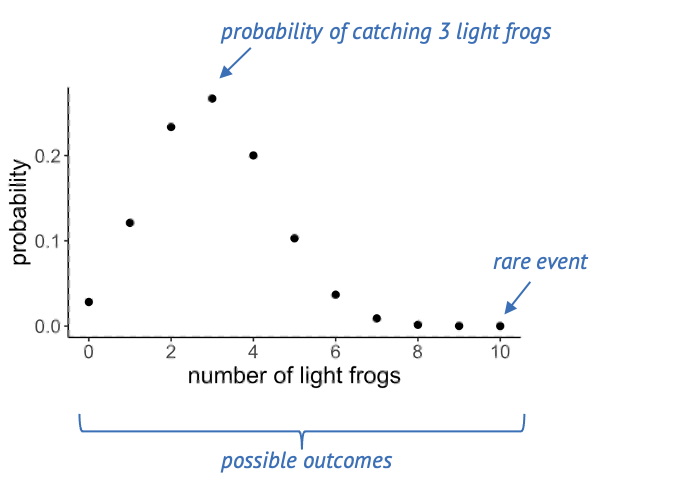
Sampling probabilities
Figure 3
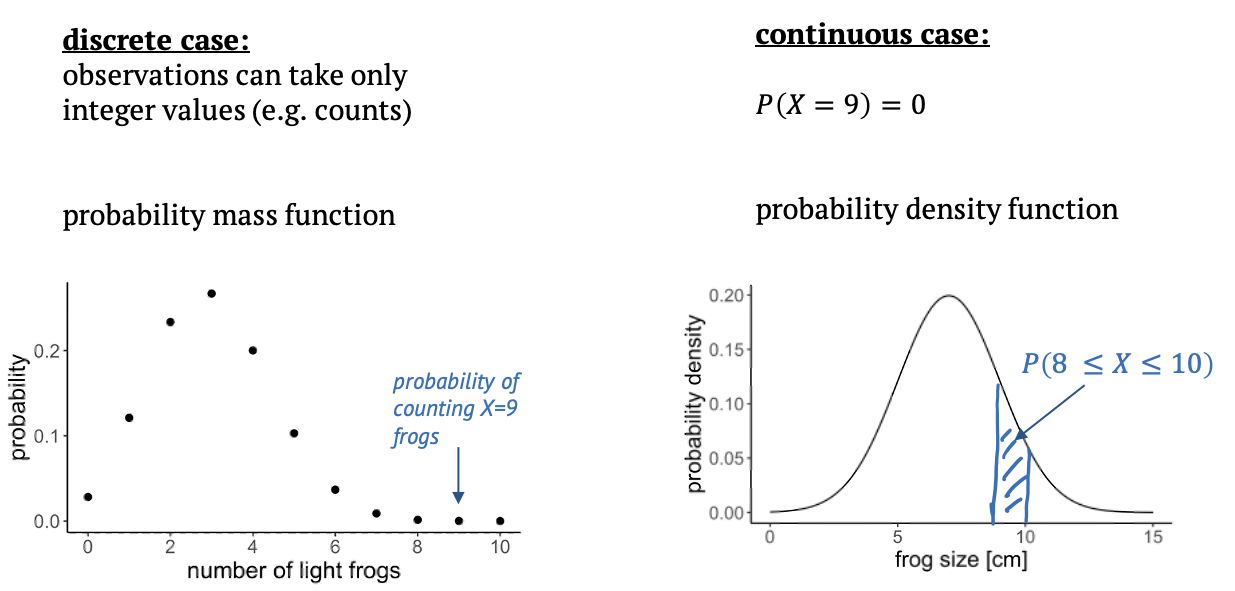
Types of probability distributions
The binomial distribution
Figure 1
Figure 2
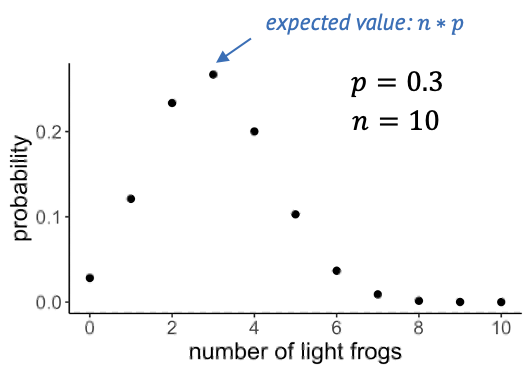
The binomial distribution
Probability distributions in R
Figure 1
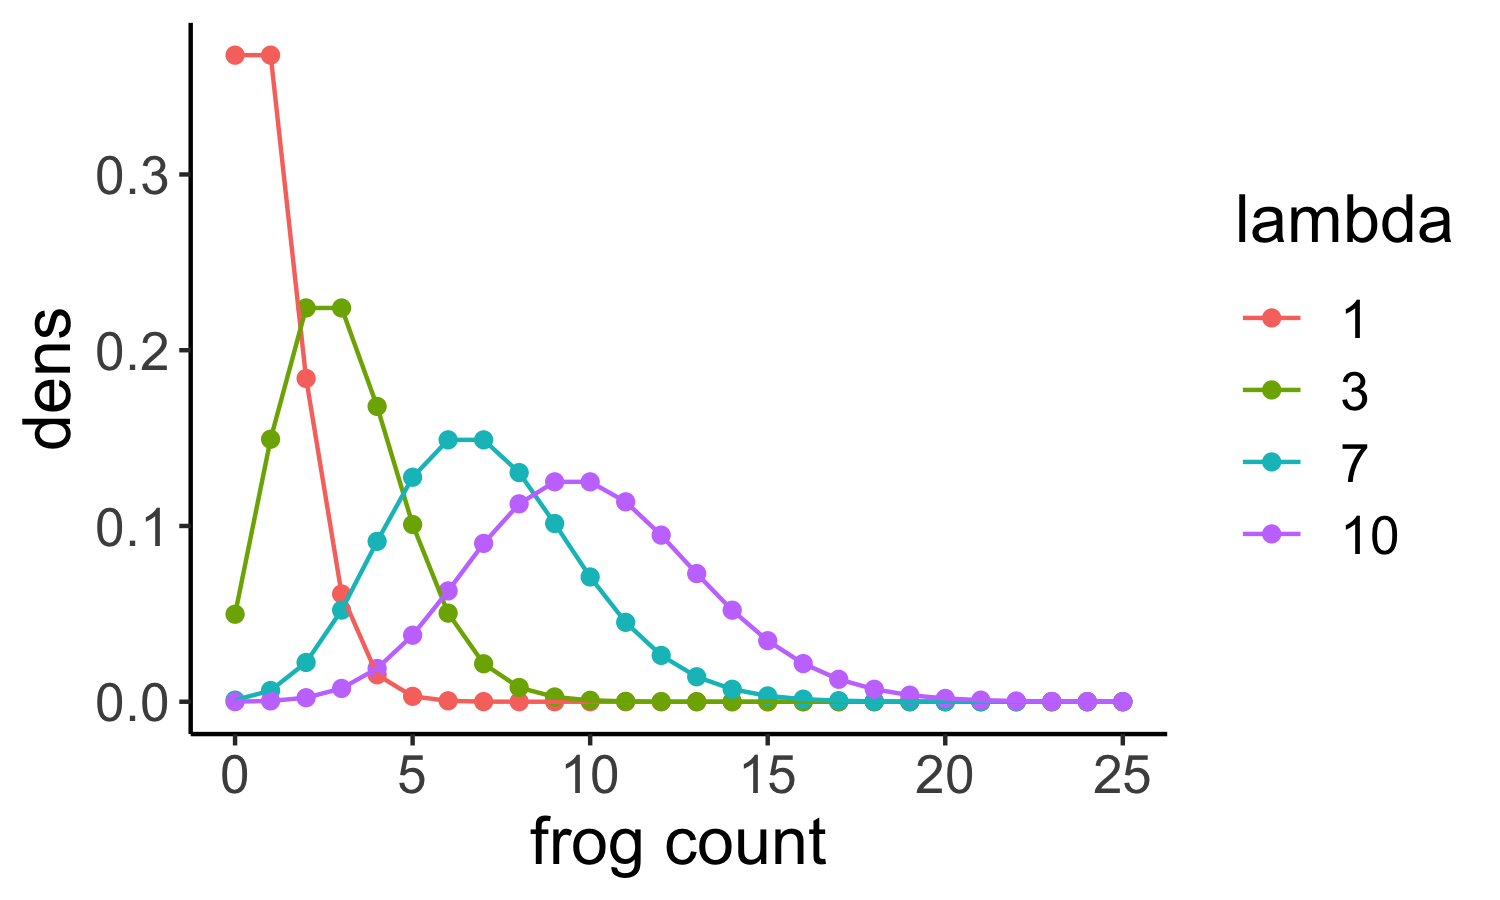
The Poisson distribution
Figure 1
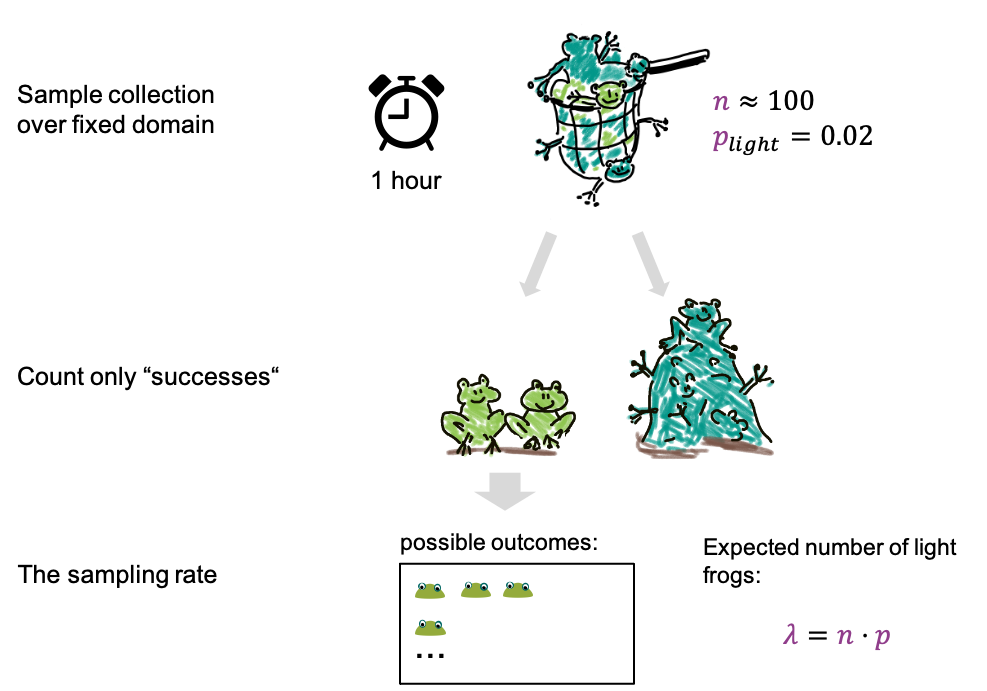
The Poisson distribution is a special case of
the binomial
Figure 2
Poisson example
Figure 3
Simulations in R
The Gamma-Poisson distribution
Figure 1
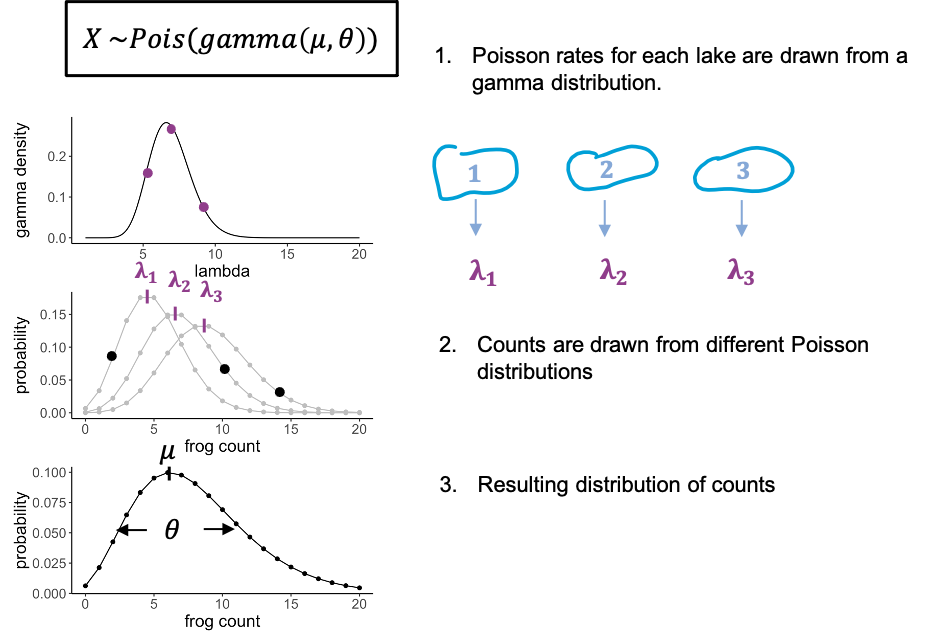
Figure 2
The Gamma Poisson distribution
The Gaussian distribution
Figure 1
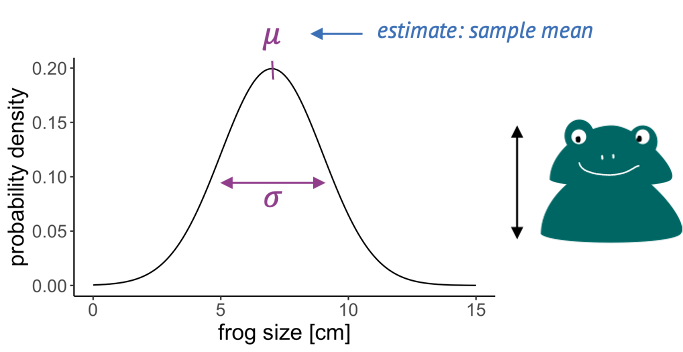
Gaussian probability density function
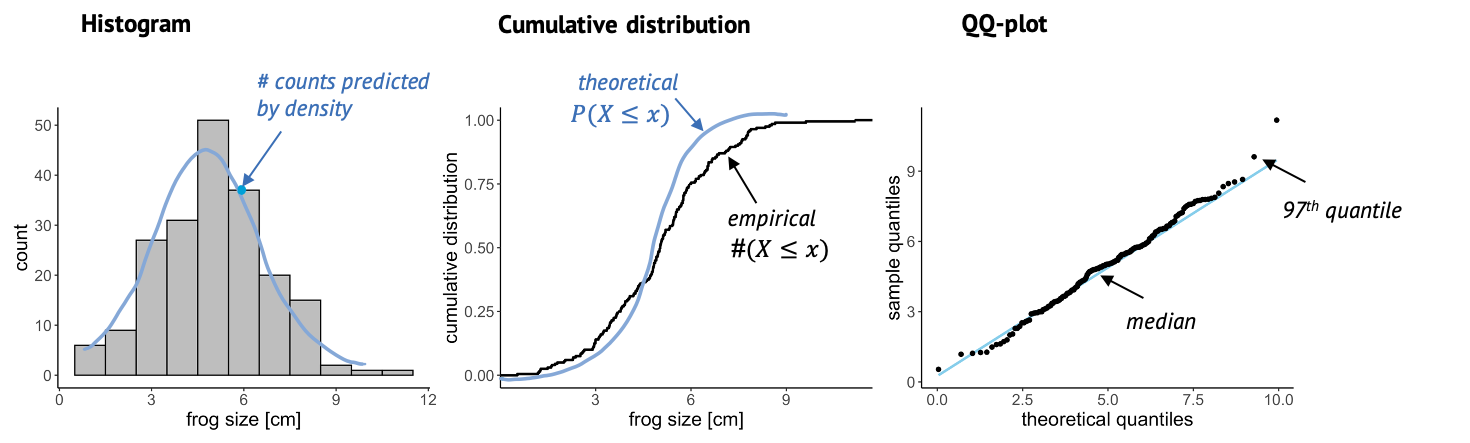
Visualizing distributions
Figure 1
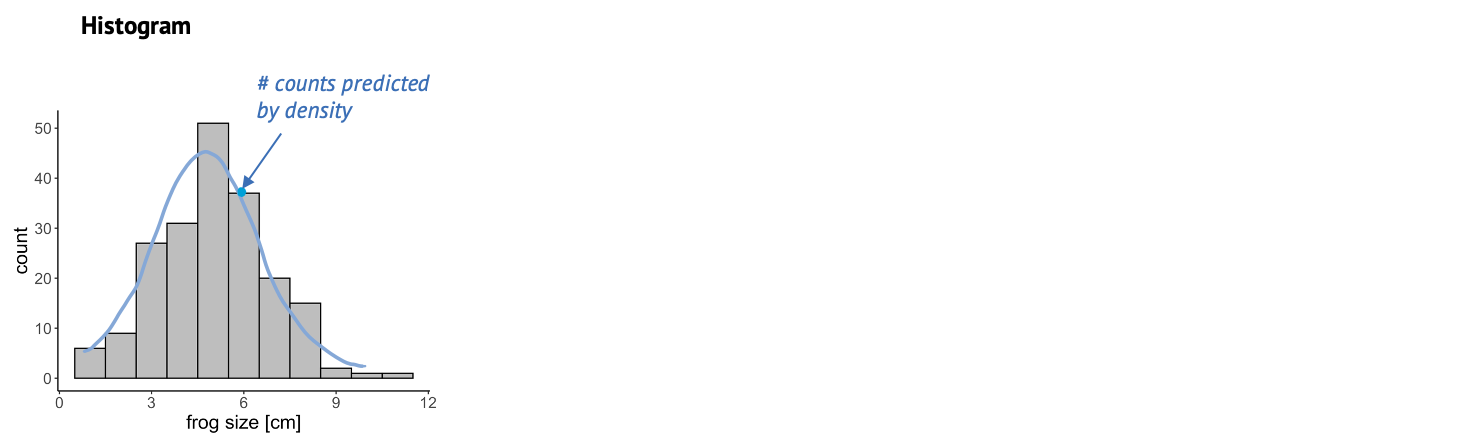
Figure 2
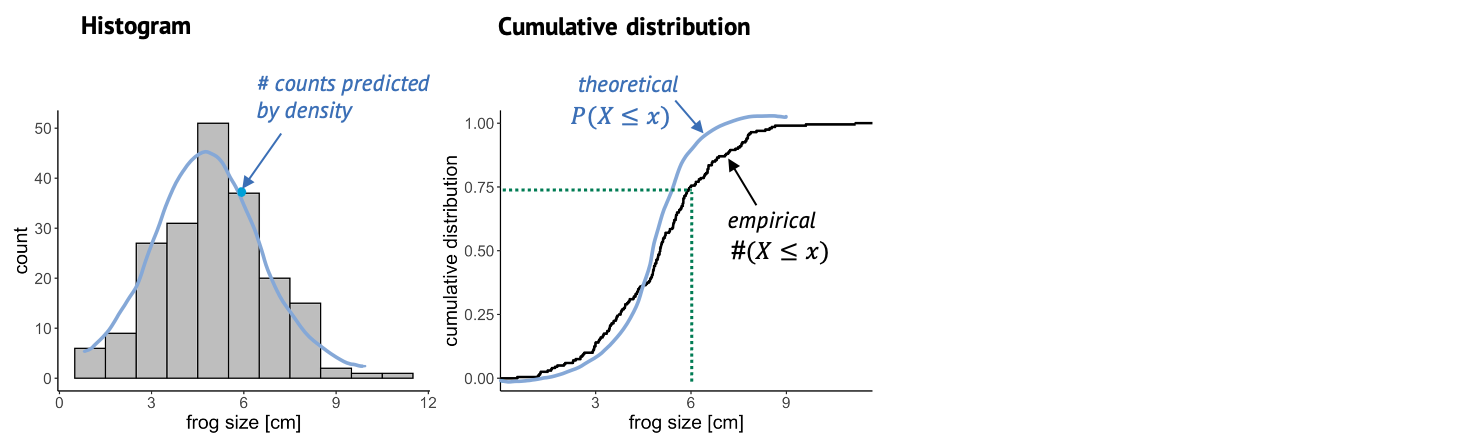
Figure 3
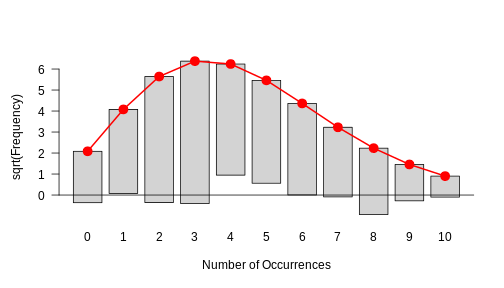
Histograms in R
Figure 1
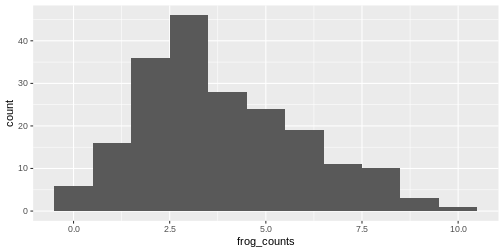
Figure 2
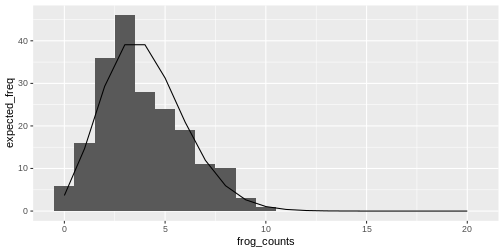
Figure 3
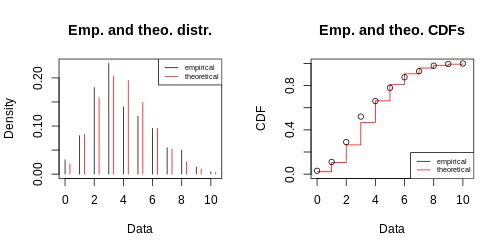
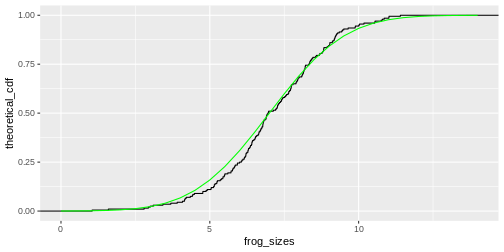
The cumulative distribution function
Figure 1
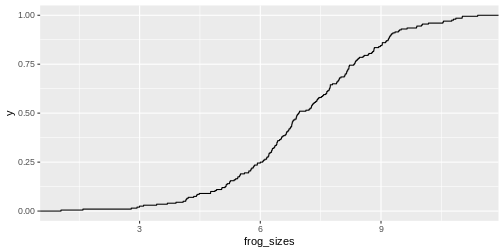
Figure 2
The QQ-plot
Figure 1
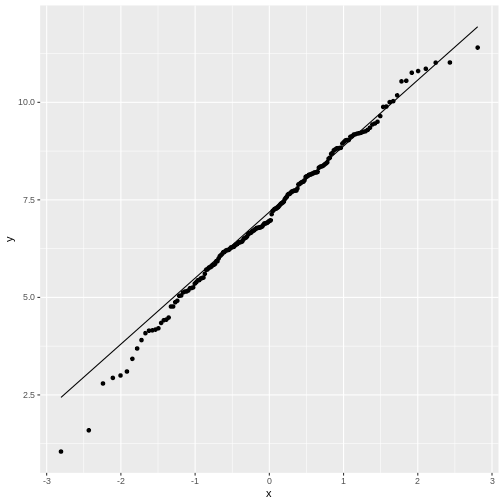
Figure 2
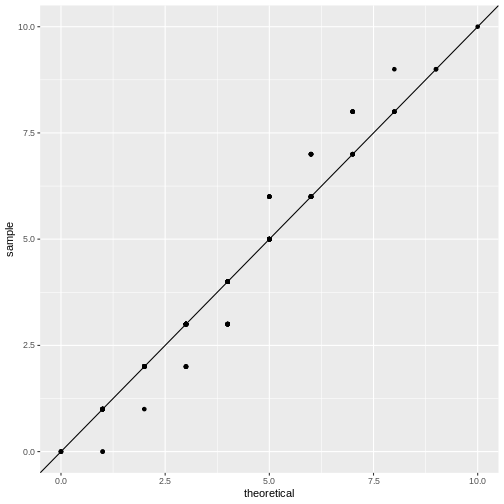
Figure 3
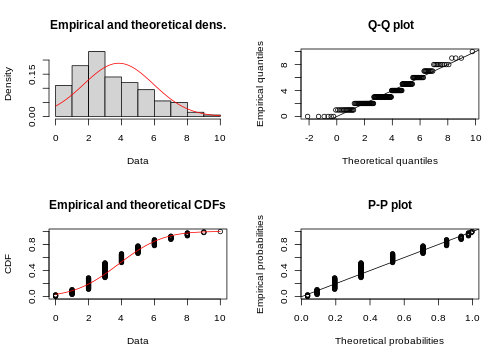
Figure 4