What is multiple testingWhat is multiple testing
Figure 1
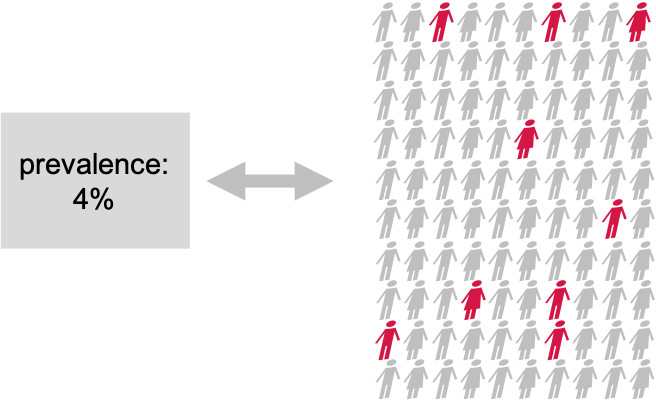
Disease prevalence in a population: We compare
the known population average of 4% to a test group in which 9/100
individuals have the disease.
Figure 2

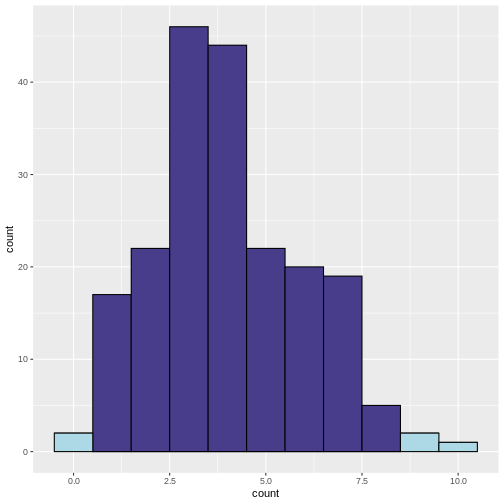
A Scenario where 100 individuals get tested for
a disease. The disease prevalence is 0.04. The experiment is repeated
200 times
Figure 3
 What does the above code do:
Types of errors and error ratesTypes of errorsImplications of type I and type II errors
Figure 1
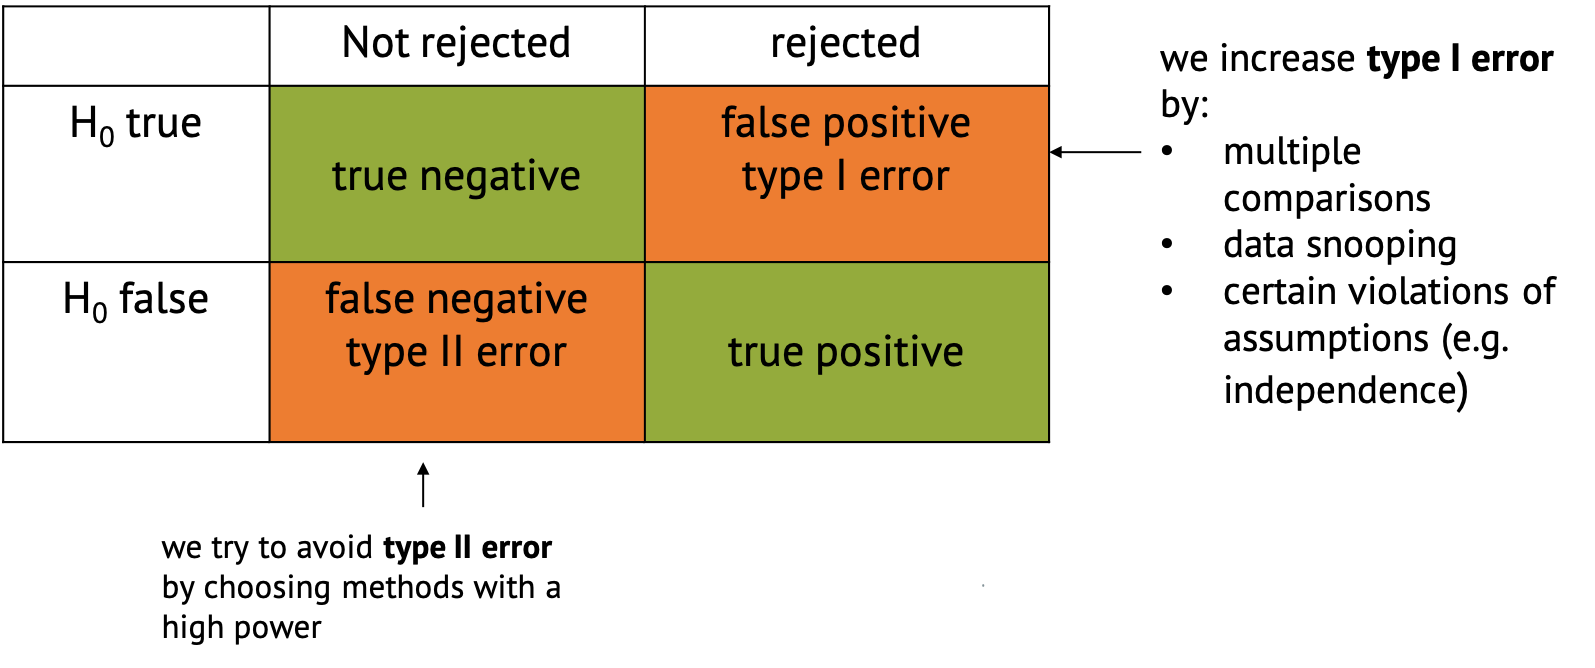
Confusion matrix
Figure 2
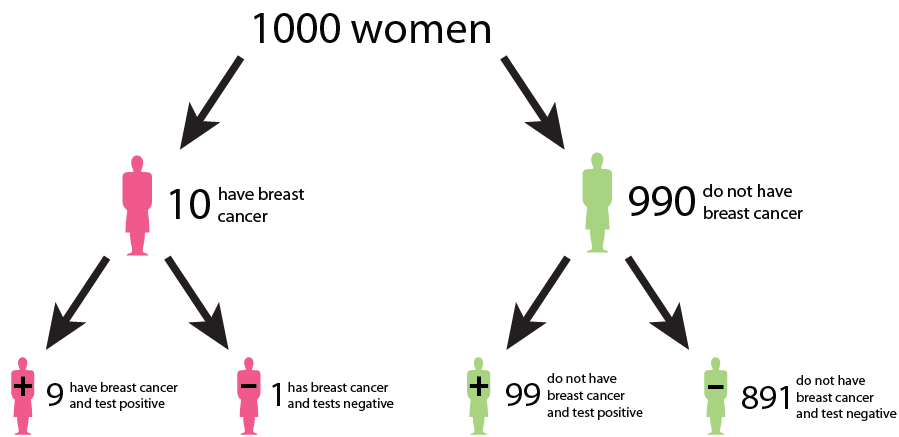
A tree diagram describing the outcomes of a
breast cancer test
Figure 3
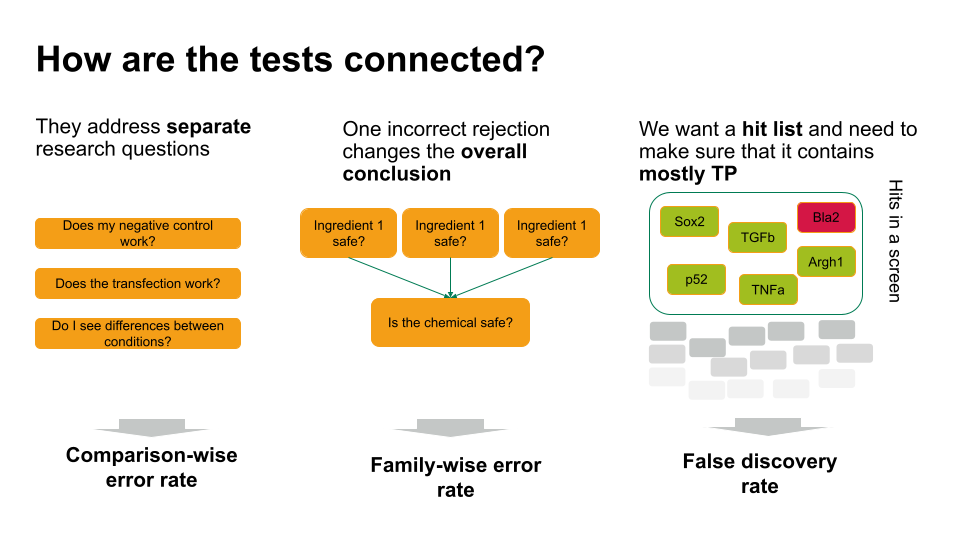
Which error rate should you control for?
Family-wise error rate
Figure 1
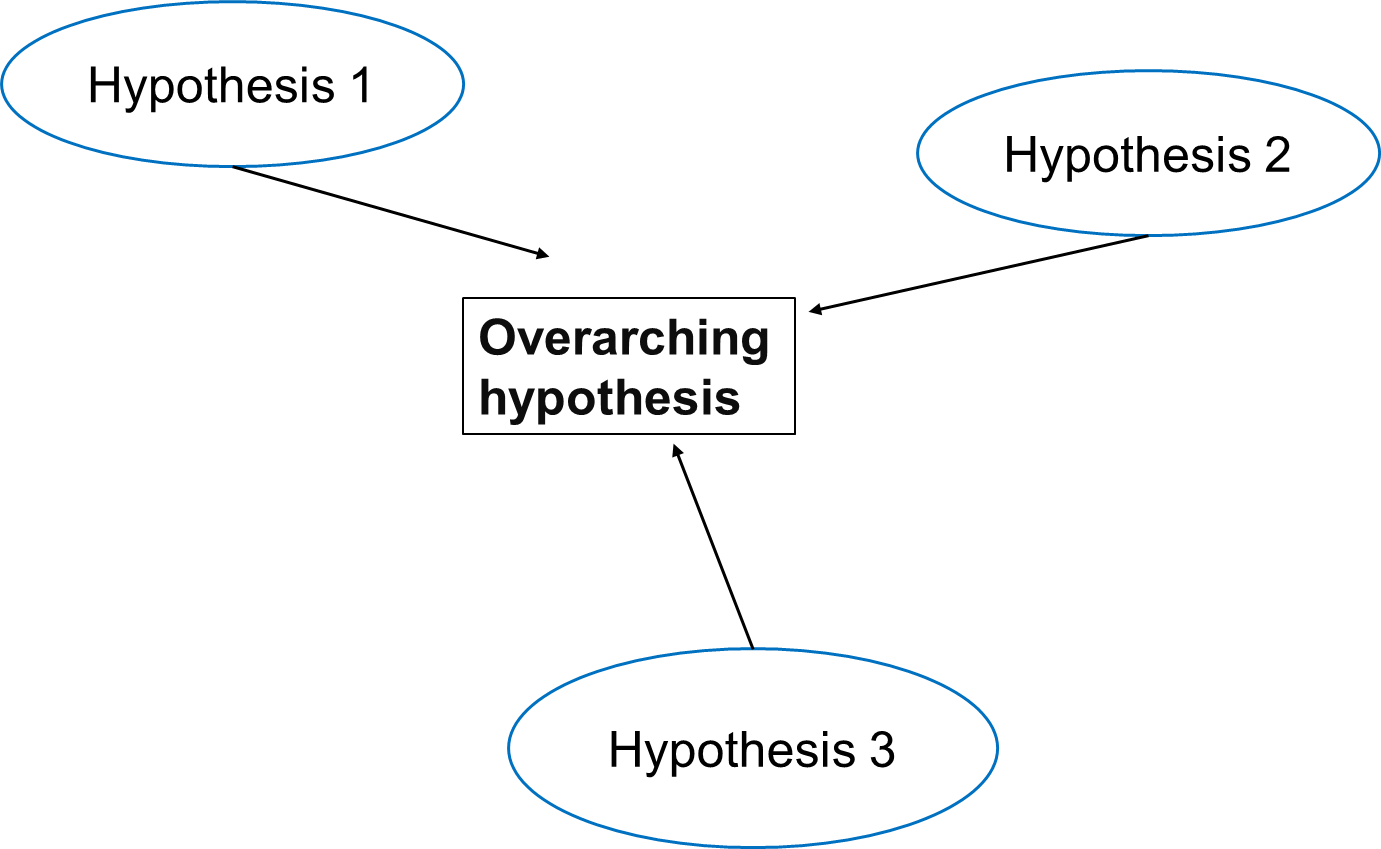
Relationship between Overall Hypothesis and
Individual Hypotheses (Effects of Air Pollution on Disease
Prevalence)
Figure 2
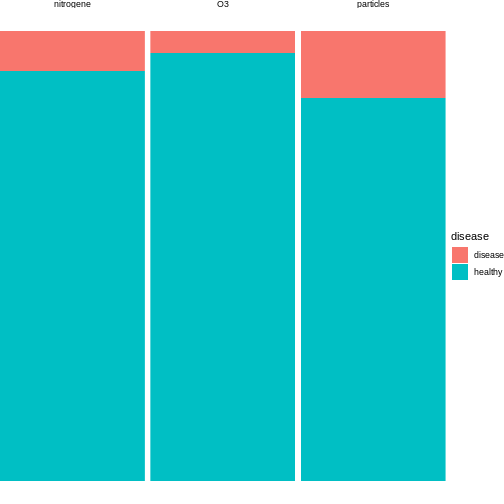
Figure 3
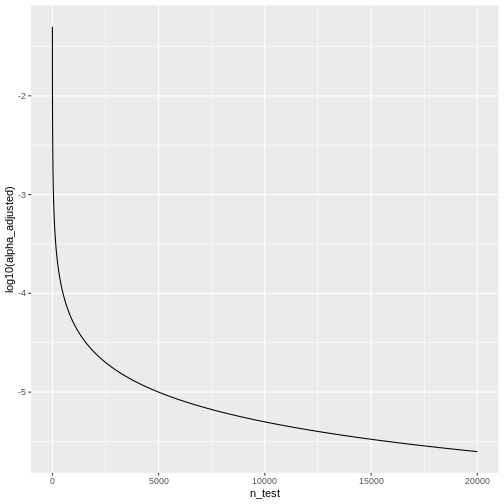 We see that the adjusted \(\alpha\) is
dropping quickly. For \(20000\) tests,
which is a reasonable number in genomic screens, alpha will be:
We see that the adjusted \(\alpha\) is
dropping quickly. For \(20000\) tests,
which is a reasonable number in genomic screens, alpha will be:
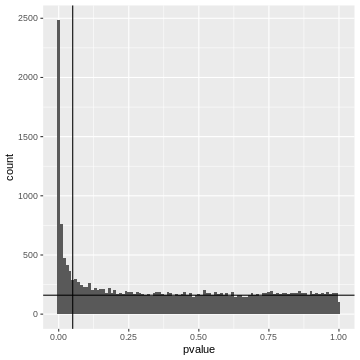
False discovery rateIntroductionThe theory of p-value HistogramsThe False Discovery RateWrap up
Figure 1

Figure 2
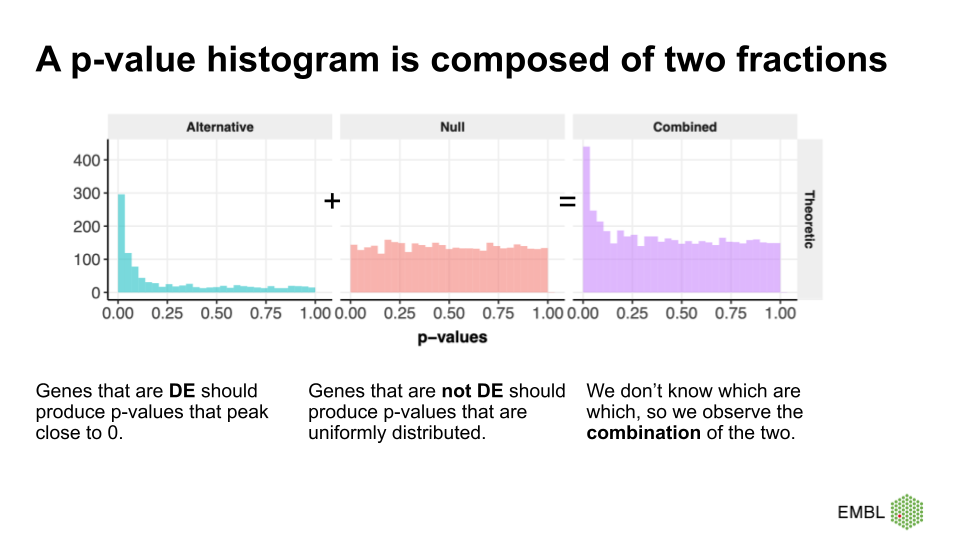
Figure credit Cecile LeSueur
Figure 3
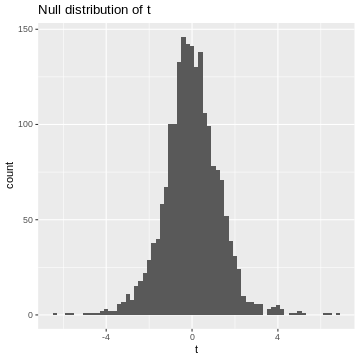
Figure 4
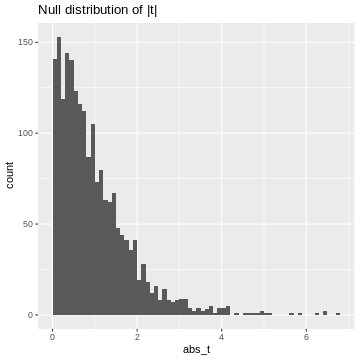
Figure 5
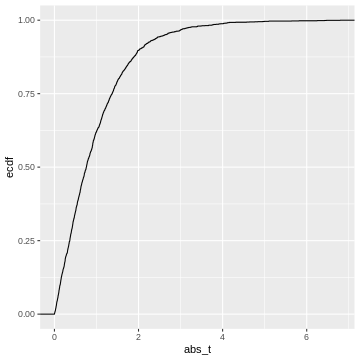 This cumulative distribution function answers the question “for a given
value of \(|t|\), how many other
elements of the simulation are smaller than this value?”. Which
is exactly the opposite of what we’re asking when calculating a p-value.
In fact, the p-value is defined as \(1-\text{CDF}(|t|)\), which looks like
this:
This cumulative distribution function answers the question “for a given
value of \(|t|\), how many other
elements of the simulation are smaller than this value?”. Which
is exactly the opposite of what we’re asking when calculating a p-value.
In fact, the p-value is defined as \(1-\text{CDF}(|t|)\), which looks like
this:
Figure 6
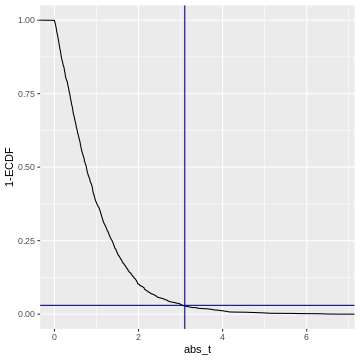
Figure 7
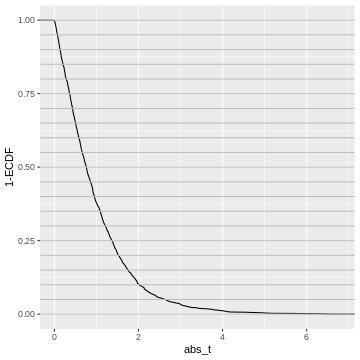
Figure 8
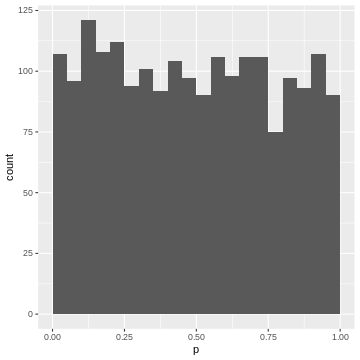
Figure 9
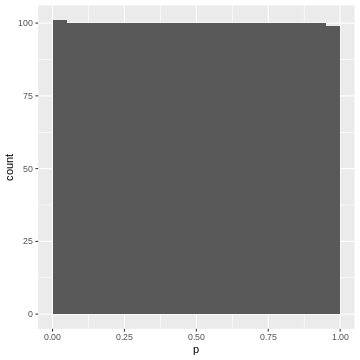
Figure 10
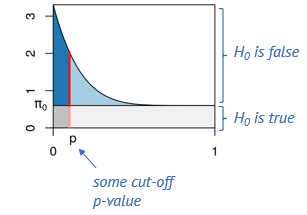
A p-value histogram decomposition (adapted from
MSMB)
Figure 11
Pairwise comparisonsPairwise comparisons
Figure 1
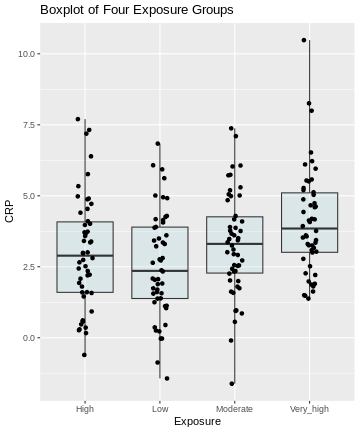
Figure 2
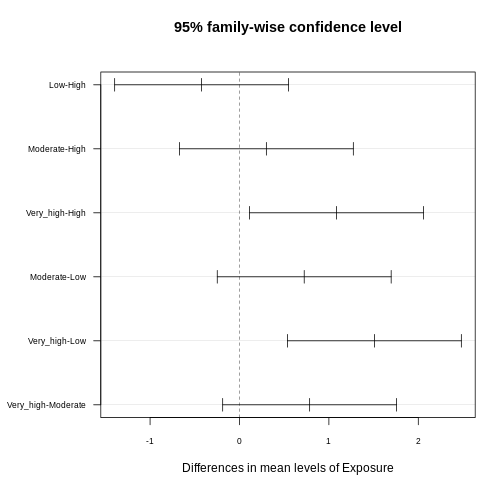
Figure 3
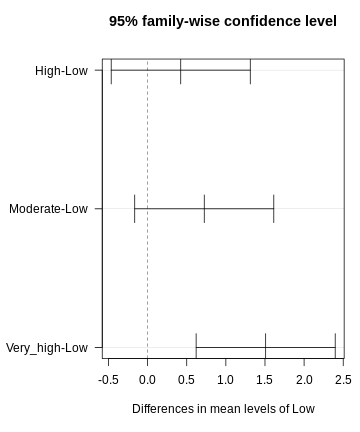
Figure 4
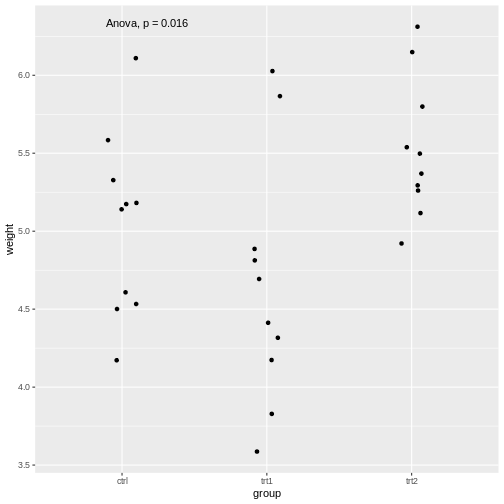
Figure 5
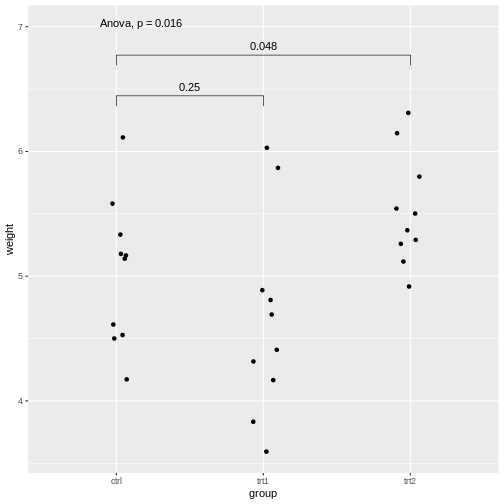
Figure 6