Probability distributions in R
Last updated on 2024-03-12 | Edit this page
Overview
Questions
- How can I calculate probabilities in R?
Objectives
- Demonstrate and practice the use of the base R functions for calculating probabilities.
- Explain the concept of cumulative distribution.
Before we look at more distributions, let’s get some hands-on
experience in R!
R knows a whole range of distributions: Here
is a list of them.
For each distribution, R has four different function calls: For the
binomial distribution, these all end with binom:
- dbinom: density
- pbinom: cumulative distribution function (percentage of
values smaller than)
- qbinom: quantile function (inverse of cumulative
distribution)
- rbinom: generates random numbers
The first letter specifies if we want to look at the density, probability distribution/mass function, quantile or random numbers. The suffix specifies the distribution.
The arguments depend on the distribution we are looking at, but always include the parameters of that function.
Calculating probabilities
Let’s use the example where we caught 10 frogs and count how many of them are light-colored.
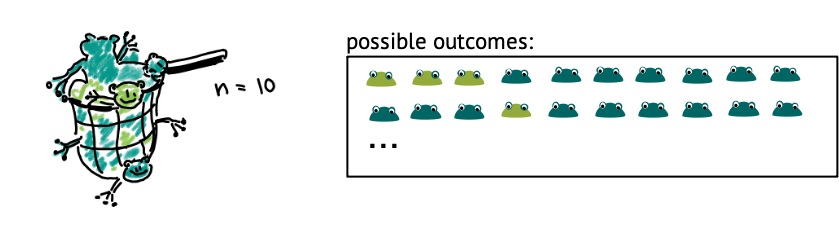
For known parameters, we can calculate the the chances of counting exactly 5 light-colored frogs:
R
n = 10 # number of frogs we catch
p = 0.3 # true fraction of light frogs
dbinom(x=5, size=n, prob=p)
OUTPUT
[1] 0.1029193We can ask for the probability of catching at most 5 light frogs. In
this case, we need the cumulative probability distribution starting with
p:
R
pbinom(q=5, size=n, prob=p) # at most
OUTPUT
[1] 0.952651Similarly, we can ask for the probability of catching more than 5 light frogs:
R
pbinom(q=5, size=n,prob=p, lower.tail=FALSE) # larger than
OUTPUT
[1] 0.04734899Catching at least 5 light frogs is a rare event.
- Exactly 7 persons:
R
dbinom(x=7,size=100,prob=0.04)
OUTPUT
[1] 0.05888027- At least 7 persons:
R
pbinom(q=6, size=100, prob=0.04, lower.tail=FALSE)
OUTPUT
[1] 0.1063923