Interpreting p-values
Last updated on 2024-03-12 | Edit this page
Estimated time: 6 minutes
Overview
Questions
- What are common mistakes when interpreting p-values?
Objectives
- Emphasize the importance of effect size to go along with p-values
- Point out common mistakes when interpreting p-values and how to avoid them
Have a look at this plot:
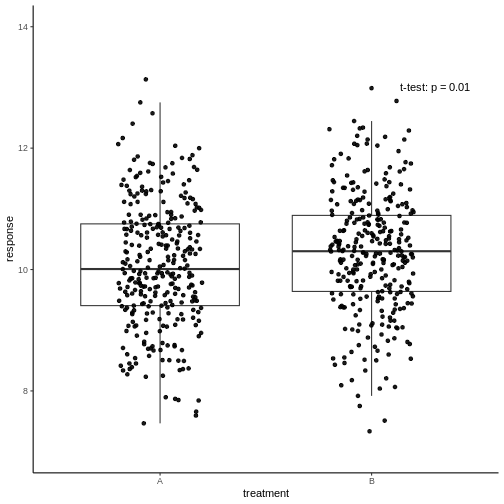
The responses in two treatment groups A and B were compared to decide whether the new treatment B has a different effect than the well-known treatment A. All measurements are shown, and a p-value of an unpaired two-sample t-test was reported.
Have a coffee and think about what you conclude about the new treatment…

So, if you were in pharmaceutical business: Would you decide to
continue research on treatment B? It evokes a higher (presume: better)
response than A, and will therefore sell better. The difference is
clearly significant. Right…?
Yes, right. But how much better is the response in B? The average
difference in response is \(0.2\),
which is only 2%. To distract from that, the y-axis of the above graph
starts at 7 – while to be honest with the viewer, it should start at
zero. Remember that a p-value can be small due to a large effect size,
low variance, or large sample size. In this case, it’s the latter. A
huge number of data points will make even the smallest difference
statistically significant. It is questionable whether an improvement of
2% is biologically relevant, and make drug B the new bestseller.
The lesson to be learned here is therefore, that statistically
significant is not the same as biologically relevant, and
reporting, or relying on a p-value alone will not give the full picture.
You should always report the effect size as well, and ideally also show
the data.
Note: In other fields, 2% can, of course, be a highly relevant difference.
Other fallacies to be aware of
- The p-value is the probability that the observed data could happen,
under the condition that the null hypothesis is true. It is not
the probability that the null hypothesis is true.
- Keep in mind that absence of evidence is not evidence of
absence. If you didn’t see a significant effect, it doesn’t
mean that there is no effect. It could also be that your data simply
doesn’t hold enough evidence to demonstrate it – i.e. you have too
little data points for the given variance and effect size.
- Significance levels are arbitrary. It therefore makes no sense to interpret a p-value of \(p=0.049\) much different from \(p=0.051\). They are both suggesting that there is likely something to see in your data that is worth following up, and none of them should terminally convince us that the alternative hypothesis is true.